نرم افزار MAXQDA 2018، نرم افزاری پیشرفته جهت تجزیه و تحلیل کیفی داده ها است که بسیار در حوزه های علوم اجتماعی و علوم انسانی و … کاربرد دارد. این نرم افزار برای دانشجویان، پژوهشگران، اساتید و موسسات تحقیقاتی که خواهان بکارگیری روشهای تحقیق کیفی، از جمله: روش نظریه زمینه ای یا داده بنیاد (grounded theory)، روش تحلیل محتوا (content analysis) هستند، بسیار کارگشا می باشد. با بهره گیری از این نرم افزار می توان پژوهش های کیفی را با زمان کمتر، دقت و سهولت بیشتر به انجام رساند.
درصورت تمایل به دریافت نسخه Maxqda 12.3.1 لطفاً به این لینکمراجعه نمایید یا در همین سفارش مطرح بفرمایید
قابلیت های کلیدی نرم افزار تجزیه و تحلیل متون MAXQDA 2018:
– سازماندهی و دسته بندی داده ها
– کدگذاری اطلاعات مهم با کد، رنگ، سمبل و …
– کدگذاری اسناد متنی
– ارائه ی مدل های متناسب با پژوهش پس از کدگذاری سندهای تحقیقاتی
– بازیابی بخش های کد شده تنها با یک کلیک
– استفاده از تجزیه و تحلیل متون MAXQDA ۲۰۱۸ برای کد کردن مستقیم فایل های صوتی و ویدیویی بدون نیاز به ایجاد Transcript
– ادغام داده های کمی با پروژه
– مصورسازی و تست تئوری ها
– گزارش گیری و استخراج نتایج بررسی داده ها
در هیچ سیستمی، برای کدگذاری مستقیم، با تکرار حروف مواجه نخواهید شد که برای رفع مشکل بخواهید در حین تایپ کردن، کلید Alt را نگه دارید.
نسخه جدید نرم افزار مکس.کیو.دی.ای MAXqda2018 در ابتدای سال ۲۰۱۸ عرضه گردید. شاید بتوان در بین تغییرات ایجاد شده در نرم افزار، تغییرات رابط کاربری را به عنوان مهمترین تغییر نام برد.
درصورت تمایل به دانلود آموزش نرم افزار Maxqda 2018 لطفاً به این لینک مراجعه نمایید
MAXQDA 2018 نرم افزار تحلیل داده کیفی می باشد در حال حاضر نرمافزار مکس کیودا مشهورترین نرمافزار تحلیل داده کیفی در بین دانشجویان و پژوهشگران ایرانی میباشد سایت رسمی مکس کیو دی ای در هر نسخه چند نوع از مکس کیودا را منتشر میسازد که معمولاً از مکس کیودا استاندارد با کمترین امکانات شروع میشود و نسخه MAXQDA pro کاملترین نسخه مکس کیودا میباشد.
Maxqda از نسخه ۱۲ تغییرات گستردهای را داشته است از جمله هماهنگی کامل آن با زبان فارسی میباشد. اوایل سال ۲۰۱۸ نسخه maxqda2018 منتشر شد که منوهای برنامه به گونه دیگری چینش شده بودند اما قابلیتها تغییرات فاحشی نداشت مگر در قابلیت بازگشت که بسیار کاربردی و مورد نیاز پژوهشگران بود. اخیراً در ماه اکتبر ۲۰۱۸ نسخهای از مکس کیودا منتشر شد قابلیتهای فراوانی را برخوردار بود از جمله این قابلیتها Word clouds 2.0 میباشد که تا قبل از این ماه در نسخه maxqda 2018 وجود نداشت هم چنین در این نسخه امکان خروجی گرافیکی کدها به صورت ابری امکان پذیر شده است. سرعت این نرمافزار بهبود قابل ملاحظهای یافته است و کاملاً با زبان فارسی هماهنگ است و فاقد مشکلاتی از جمله تکرار حروف فارسی میباشد.
کدگذاری کارآمد
تجزیه و تحلیل متون MAXQDA18 ورژن ۲۰۱۸ : در این نرم افزار می توان بخش های مختلف اسناد گوناگون به صورت متن، جدول، عکس ، صوت و تصویر با فرمتهای doc / docx / xlsx / txt / rtf / pdf / mp3 / mp4 / jpeg / … را به صورت کیفی کدگذاری نموده و علاوه بر این می توان با استفاده از ابزار کدگذاری خودکار، اسناد متنی را نیز کدگذاری کرد.

تجزیه و تحلیل متون MAXQDA18
ابزارهای بصری
پس از کدگذاری اسناد، می توان از ابزارهای متنوع بصری ای که نرم افزار تجزیه و تحلیل متون MAXQDAورژن ۲۰۱۸ در اختیار محقق قرار می دهد، جهت تجزیه و تحلیل و ارائه نتایج بهره برد.

جستجوی پیشرفته
از جمله امکاناتی که تجزیه و تحلیل متون MAXQDA ورژن ۲۰۱۸ برای پژوهشگران فراهم نموده، ابزار جستجوی پیشرفته آن است که امکان جستجو با استفاده از چندین عملگر را مهیا می سازد.

مدلسازی
در نرم افزار تجزیه و تحلیل متون MAXQDA ورژن ۲۰۱۸ ابزارهایی تعبیه شده تا بتوان پس از کدگذاری استاد تحقیق، مدل های متناسب با پژوهش را طراحی و ارائه نمود.
بازیابی
برترین ابزار تسهیل کننده نرم افزار تجزیه و تحلیل متون MAXQDA 2018 ابزار بازیابی و نشر مطالب است. با استفاده از کارویژه بازیابی، پژوهشگر می تواند به صورت سفارشی مطالب کدگذاری شده مورد نظر خود را به صورت یک مجموعه منسجم بازیابی، مشاهده و بررسی و در صورت لزوم بصورت یک کتابچه ارائه نماید.

New Interface
All of the powerful functions at a glance: ribbon menu and tooltips for every icon
MAXQDA’s powerful functionality has a new look! But don’t worry, we’ve kept the classic four window design. Instead, we’ve replaced the old toolbars with a ribbon menu and integrated several functions into the windows themselves – right where you need them.
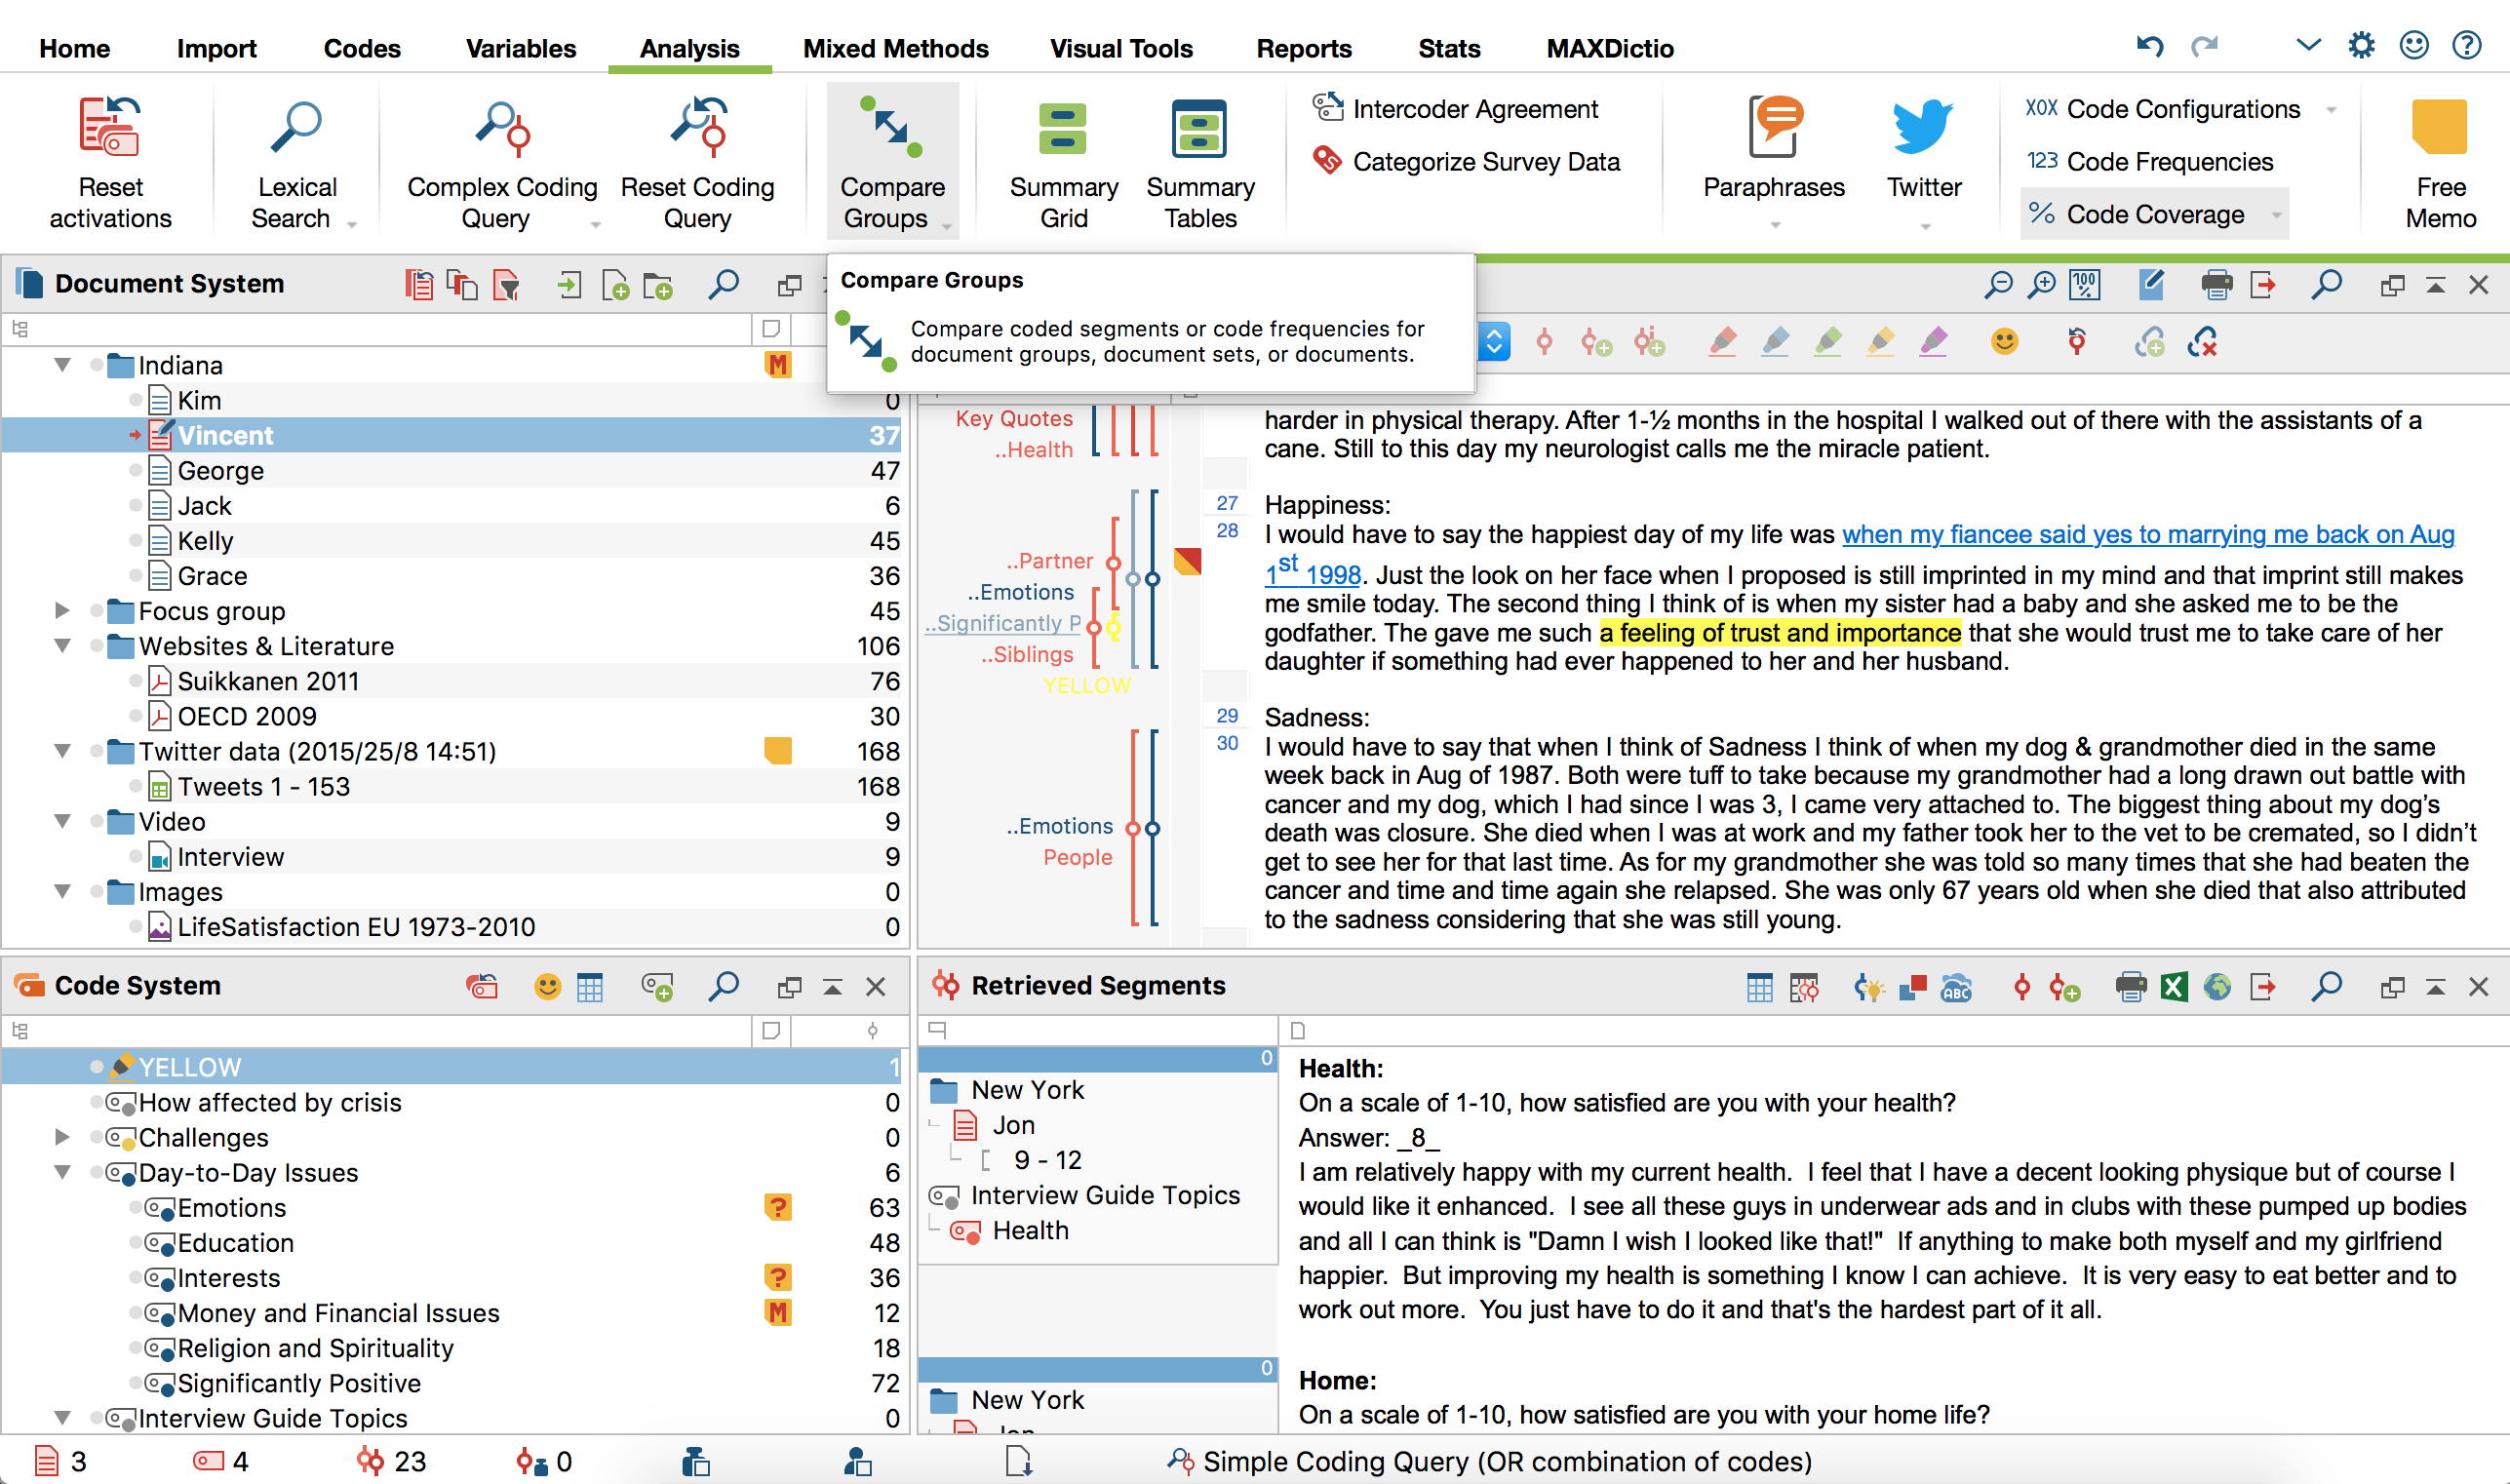
Meanwhile, we’ve also restructured the entire menu system to make it even more intuitive and easier to navigate. And if you’d like to see more of your data – instead of our beautiful new icons – you can simply hide the new menu with one click.
To make MAXQDA even easier to use, all the options in the ribbon menu’s tabs are not only labelled but come equipped with tooltips that offer quick insights into each function.
Seven New Analytical Features
Paraphrasing
Summarize material in your own words
Summarize sections of your data in your own words with MAXQDA’s handy Paraphrase mode. Paraphrases you have already written can then be displayed directly adjacent to the text, so you can always keep them in view.
The new “Categorize Paraphrases” function can help you create new code systems. This practical tool is ideal for inductively forming new categories for your material and is suited to numerous methodological approaches.

Smart Coding Tool
Manage coded segments quickly and easily
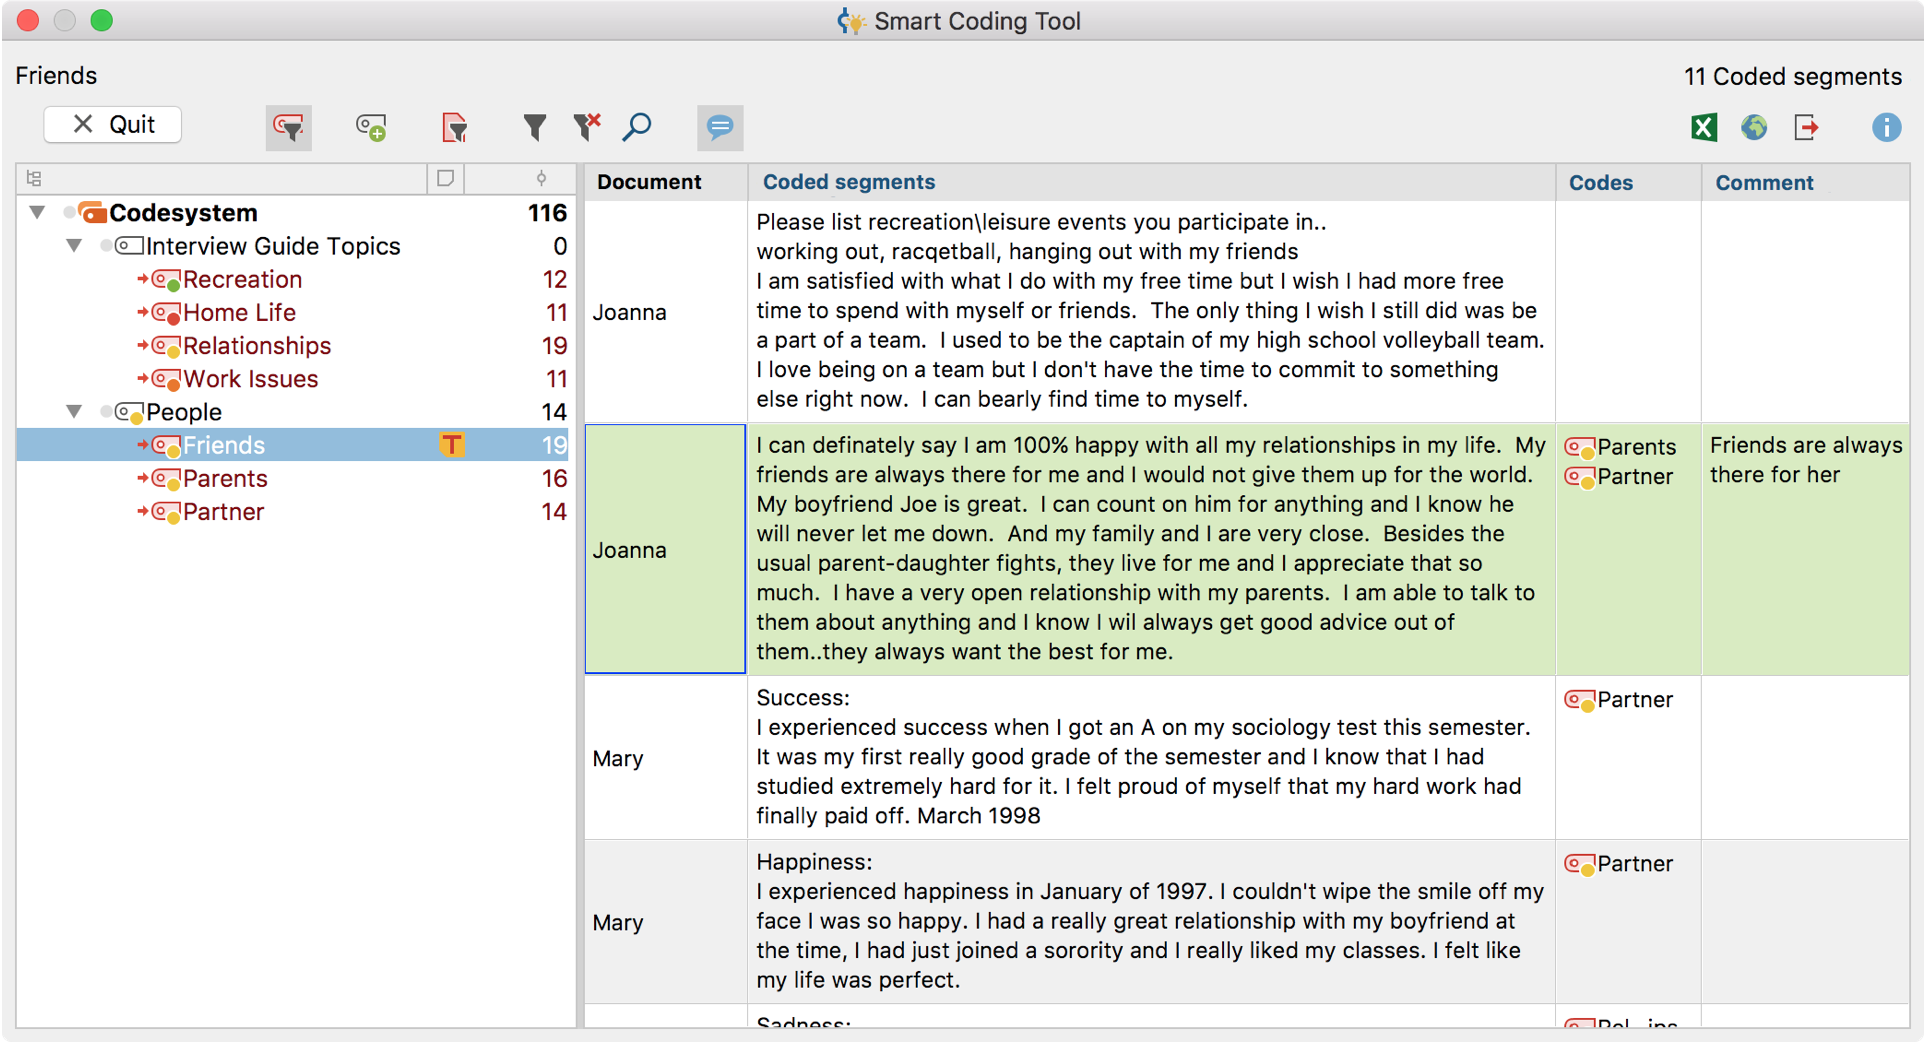
The categorization of data segments is a key function of any QDA software and thanks to its user-friendly four window interface and creative coding function, MAXQDA is already global pioneer in this area. Our new Smart Coding Tool takes this strength one step further.
This tool makes allocating individual data segments to codes that much easier, faster and – above all – clearer. Particularly in advanced coding stages, the Smart Coding Tool helps you check allocations, make corrections, and keep track of the overall picture.
Code Coverage
A milestone for many analysis methods
The analysis of code frequencies is one of MAXQDA’s oldest standard tools and represents a fundamental component of countless methodoligcal approaches. With MAXQDA 2018, we have complemented this analysis approach with two new and universally useful functions.
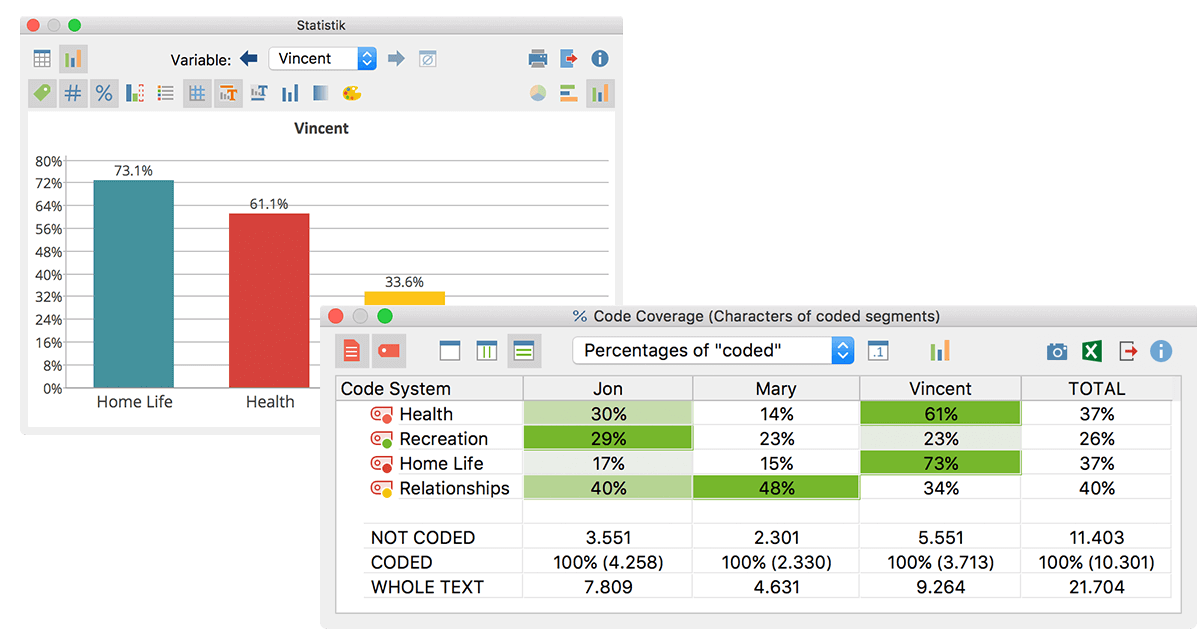
The Code Coverage tool compares the extent to which coded segments cover different texts, images and videos. You can analyze the percentage to which a document – or only the coded parts of a document – are assigned to specific codes.
With its inbuilt statistics functions for generating and customizing tables and charts, you can process this information with MAXQDA and export it in several formats.
Code Configurations
… and “complex” code configurations at a glance.
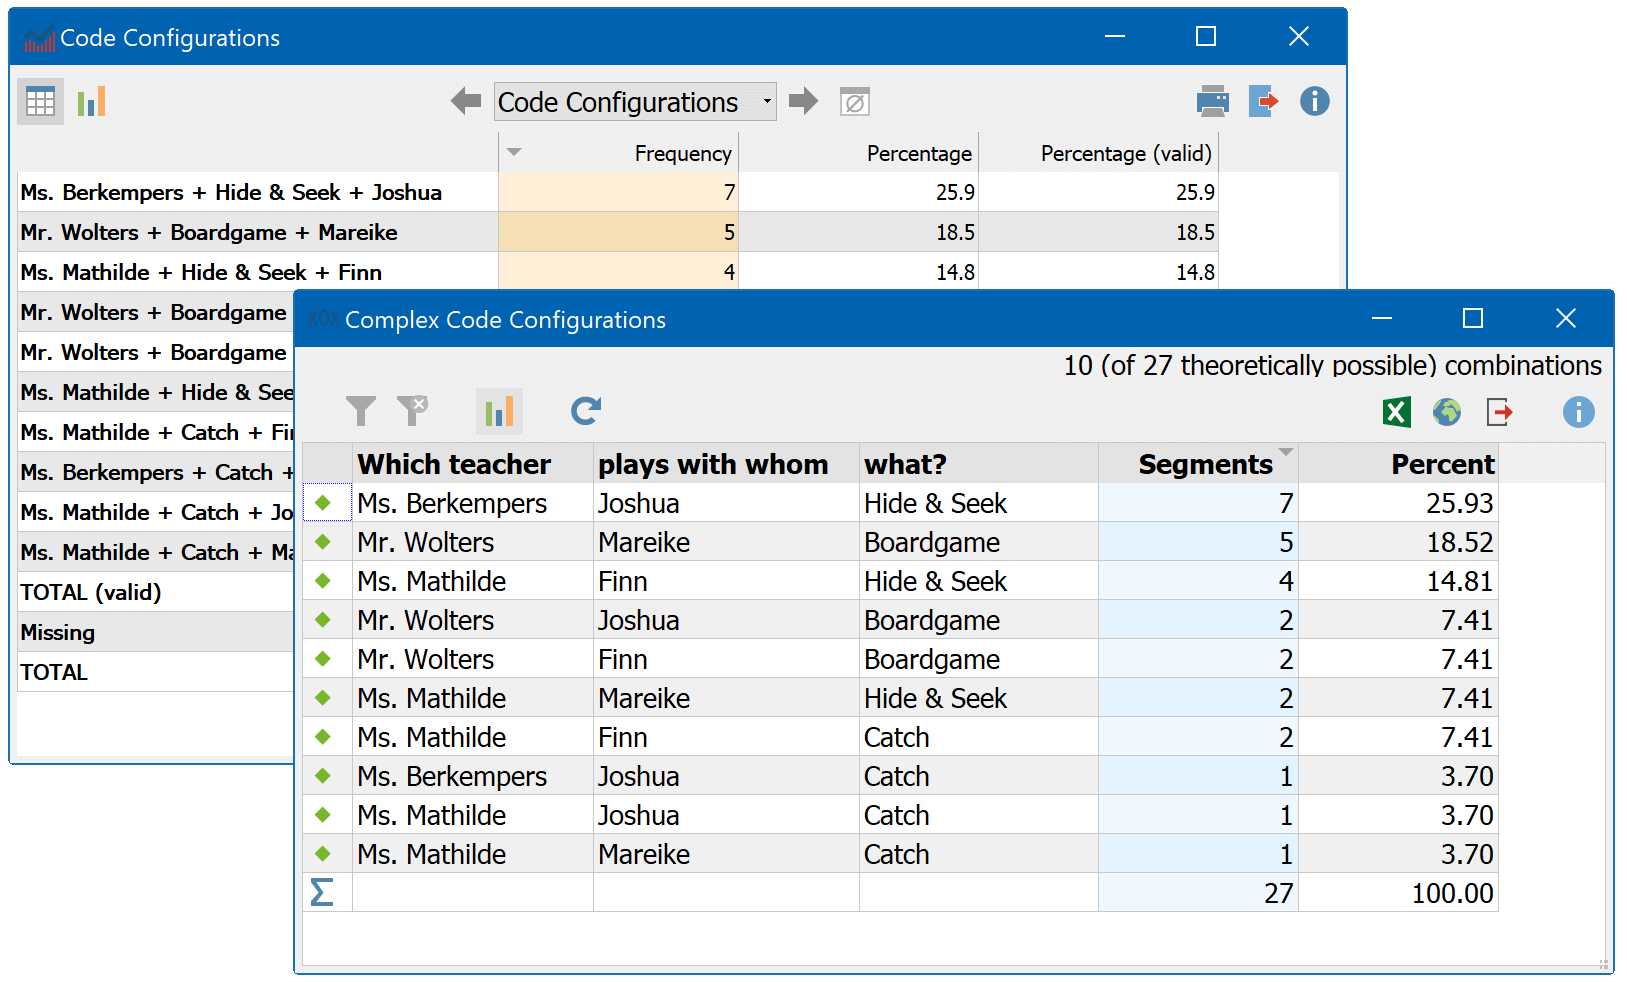
This is a particularly useful tool for almost all forms qualitative and mixed methods analysis. The Code Configurations function enables you to quickly and easily display which codes occur in combination and how frequently they do so – and you can visualize all these results as charts too.
With the Complex Code Configurations extension, you can examine up to six dimensions at once! And as these results tables are interactive, you can click on a code combination to display all the data segments to which it applies in the Retrieved Segments window.
Twitter Statistics
New Twitter analysis functions
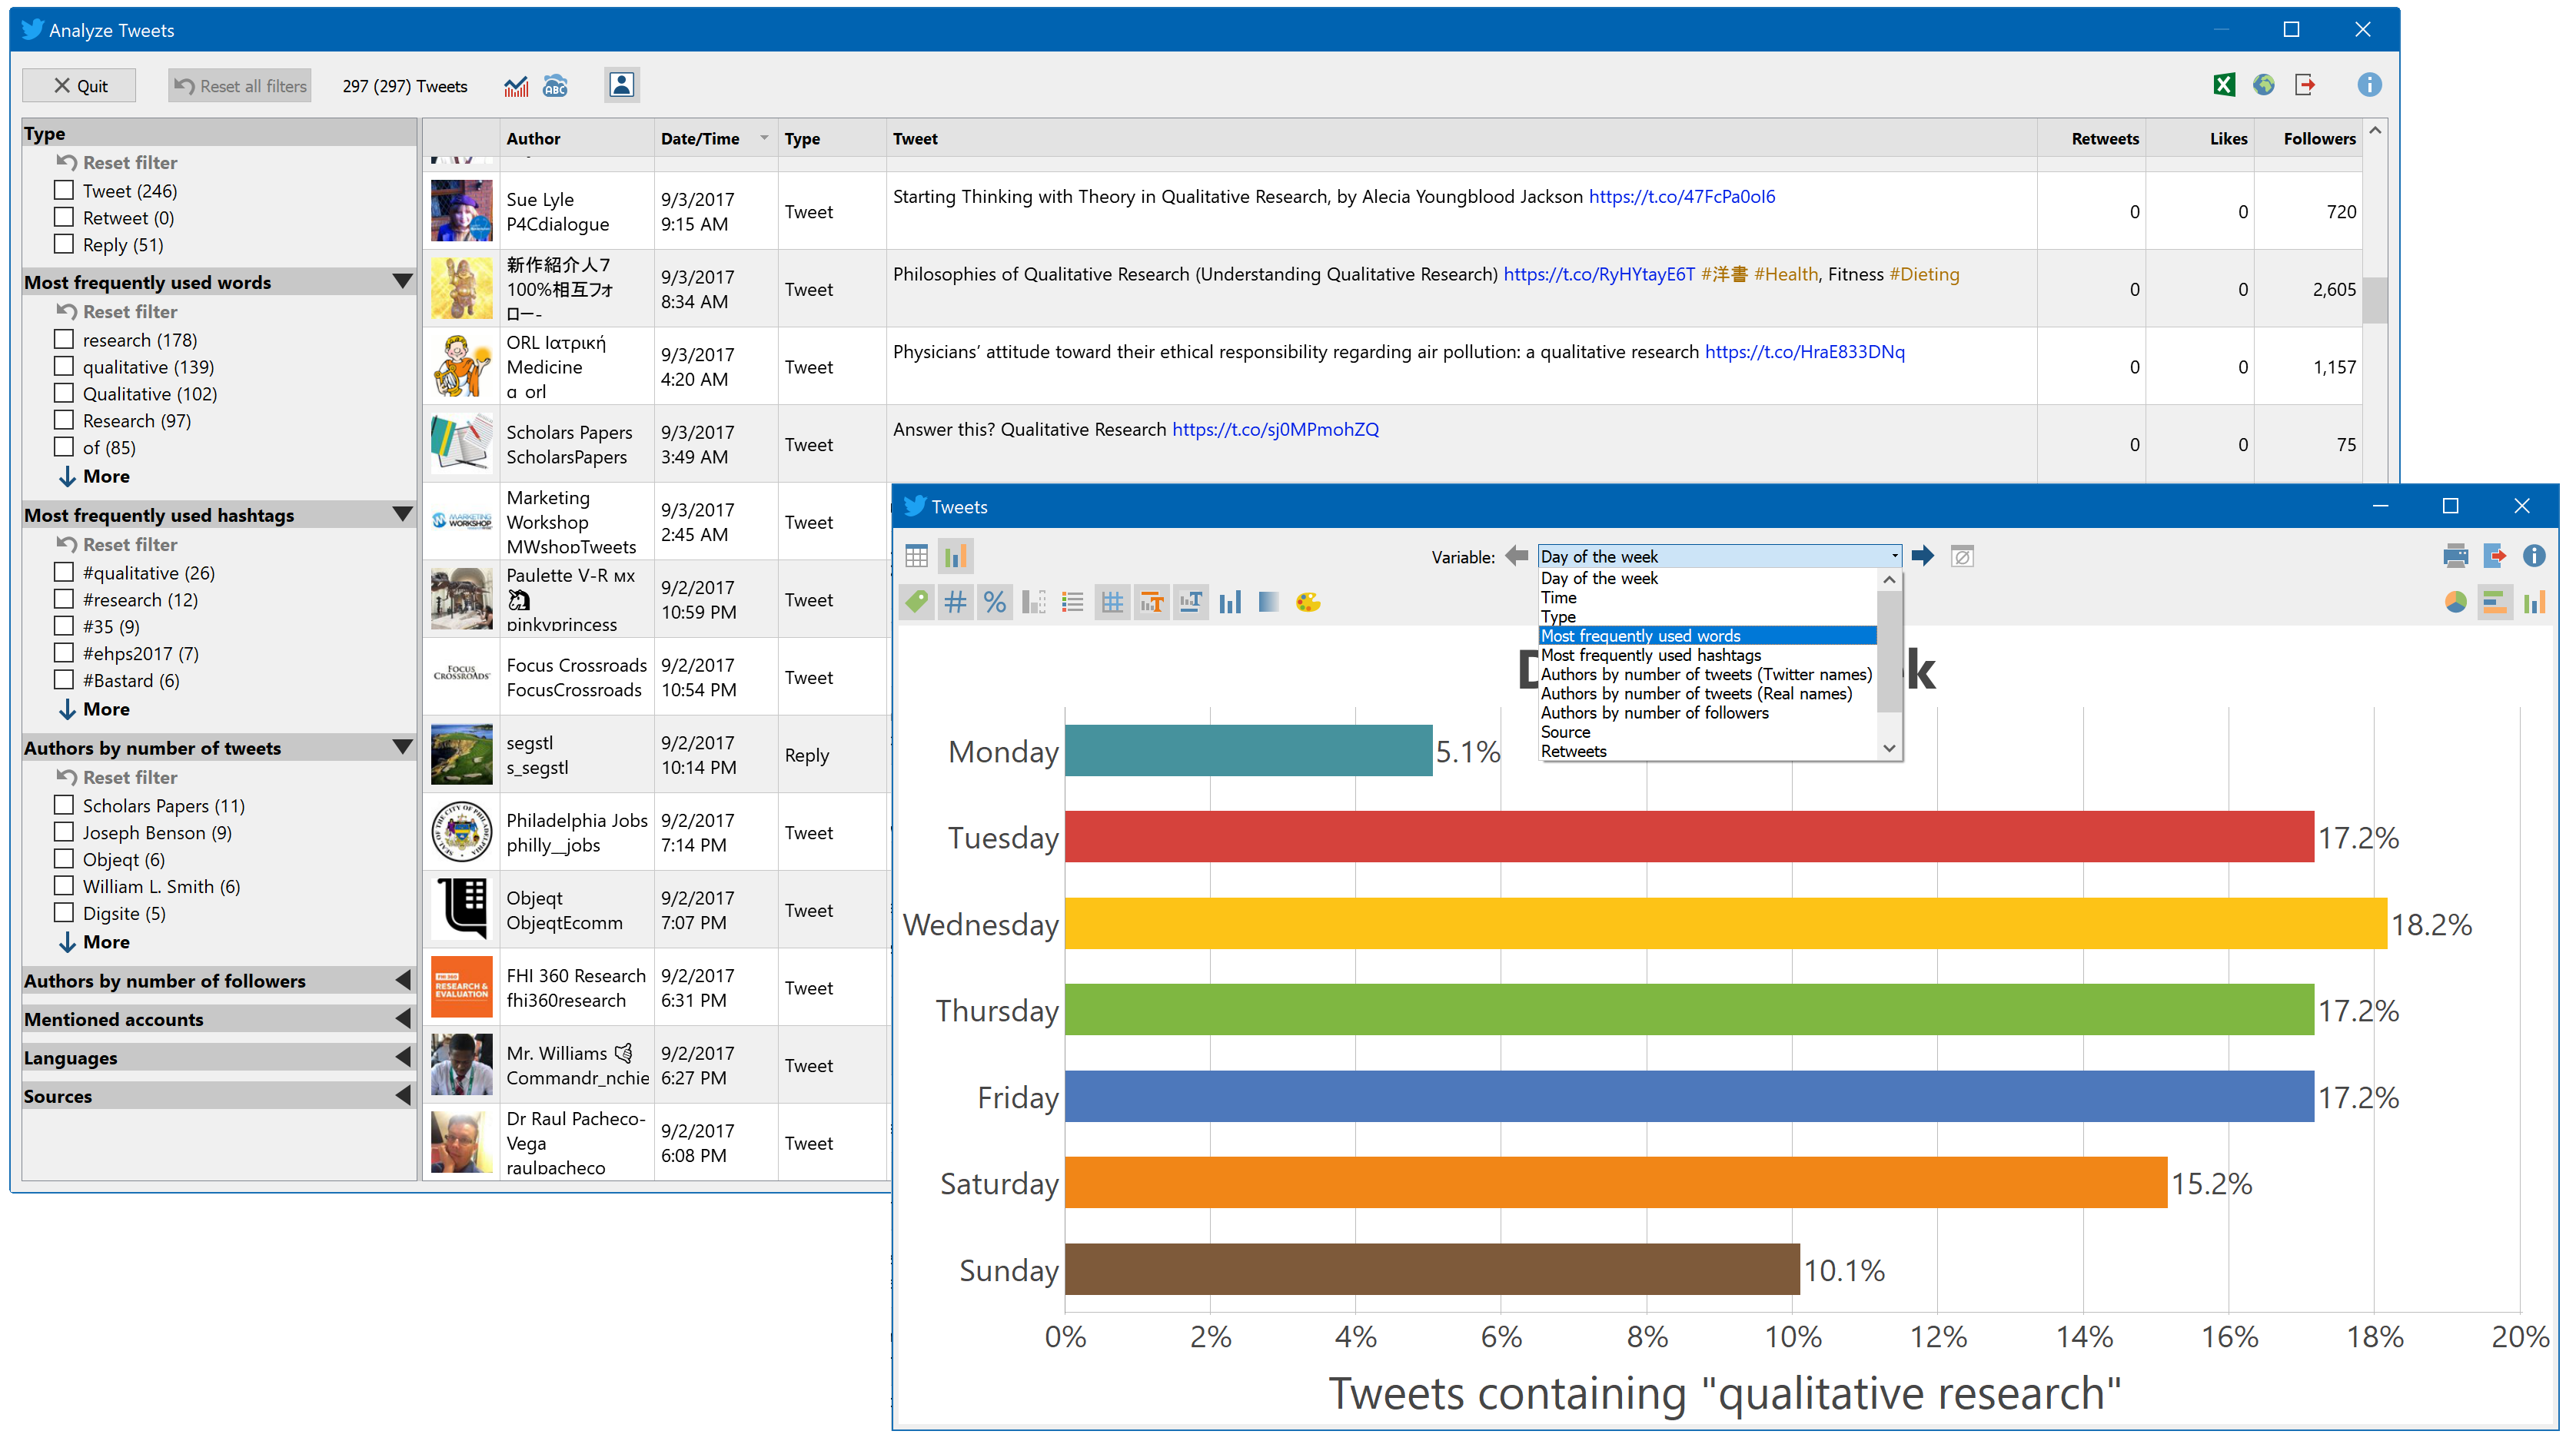
Great news for everyone working with Twitter: With MAXQDA 2018, we’ve massively expanded the program’s Twitter functionality!
The new Twitter analysis tool includes multiple filters that let you conduct a comprehensive statistical evaluation of collected tweets. Automatic charts offer information about a tweet’s reach, the number of “Likes”, and the date and time of their publication.
In addition to all the features available in the last version, you can now also include the tweet type (tweets, retweets and replies), the profile picture of its author, the language, device type, geolocation and all replies to a tweet in your analysis.
 Global Undo
Take it all back!
Undo functions were already available in earlier versions of MAXQDA – but they were limited to specific processes (such as coding, editing documents and making changes in MAXMaps).
MAXQDA 2018 takes this several steps further, because with the new global undo function you can undo anything MAXQDA. So now you can retrieve that accidentally deleted code with one click.
Additional New Features
Save anonymized projects
If your project contains sensitive data, MAXQDA 2018 lets you automatically save an anonymized copy of the project. A prerequisite: The sensitive text areas must first be appropriately coded. When you save an anonymized copy, all the text locations coded with selected codes will be replaced by XXX and/or the code name, rendering them anonymous.
Reports for summaries with coded segments
With MAXQDA 2018, you can now create reports in Word, which displays your summaries together with their corresponding coded segments in a table overview. For each selected code, the generated report displays the coded segments in selected documents in a separate column and supplements these with summaries in another column.
Interactive Quote Matrix
The Interactive Quote Matrix function allows you to display coded texts or image segments from specific source documents. These documents are selected and compared according to conditions for document variables which you can freely define. This allows you to quickly and easily compare the views of different groups on a selection of topics.
You can also view all your memos and/or comments connected to the displayed segments as a further option. And as the function is interactive, you can jump from the segment to the original with a single click to view the material in its original context.
Codes and coding
- Create multiple codes directly in the “New code” dialog window without closing the window
- Display columns with variable values in the “Overview of Retrieved Segments”
- Previously assigned shortcuts are visible in the property menu of a code
- You can hide the display of a segment’s weight in your “Retrieved Segments”
- Frequencies in the “Code System” can either show the total number of times a code has been assigned, or display in how many different documents a code was assigned
- Assign or change code colors more quickly with predefined colors
- Include codes that don’t have a code memo in the codebook export
- Frequency tables and charts display more information about the number of documents and segments in which selected codes occur.
- Statistics for subcodes: informative labels for easy interpretation
- The Complex Coding Query now allows you to drag and drop codes directly from your “Code System”
- You can display comments on coded segments right next to the document in a separate comment column
- Intercoder Agreement: Analyze coded segments in a document against a reference document
Documents
- Add selections from texts, PDFs or image documents as a new document to the “Document System”
- Simpler and faster creation of new text documents
- New text format option: “Struck-through”
Memos
- Sort the “Overview of Memos“ by date and time of last memo edit
Summarys
- Insert summary tables as a table document into the Document List
- Display or hide comments, memos, and sources in visualizations
Visualizations
- Create a Word Cloud of the most frequently occurring words from the content of the”Retrieved Segments” window
- The Code Relations Browser (overlapping codes) can be limited to the segments in your “Retrieved Segments” window and can be opened from directly here
- The Code Relations Browser lets you select filter codes so that only the coded segments that occur within this code are evaluated
- Code Matrix Browser (codes per document) and Code Relations Browser: the size of the square symbols factors in the difference between the smallest and greatest values
- Code Matrix Browser and Code Relations Browser: both allow you to change the code system display between a hierarchical or list structure; unactivated parent codes are ignored in the case of a list display
- Code Matrix Browser and Code Relations Browser: Improved calculation for size of visualizations (squares/circles) for more intuitive interpretation
- Document Comparison Chart: compare texts, PDF documents and media files of any length by standardizing the length to 100 units
- Document Portrait: four new sizes for the overall portrait picture picture and you can choose either a square or rectangular shape
Mixed Methods
- When activating documents according to variables, several new comparative operators can be used, including “variable value is less than or equal”, “Greater or equal” and “contains”. These additions are also useful for other processes, such as creating a quote matrix or crosstab
- Create a quote matrix for your coded segments and comments or only comments
- Quote matrix shows information about the number of documents in each column heading
- Quantitizing: Transform all activated codes into document variables at once
- Crosstab: Display codes with a “collapsible” hierarchy so that subcodes can be aggregated
Search in Text
- Easier entry of multiple search terms using the return key
- Your last search terms are saved with the project file
- Save and load advanced search settings
- A “beginning of words” option for contextual searches in the “Document Browser” and the “Retrieved Segments” window
- The default lemmatisation corresponds to your MAXQDA interface language
Teamwork
- Limit Teamwork exports to include only content in activated documents and/or codes
- Save activated (as well as coded) documents as a separate project
Overview Tables
- Filter and sort table columns in multiple levels and reset sorting for all columns of a table
- Simplified filter customization
Export
- Project components can be exported collectively as Excel files
- The export function for coded segments as text and tables has been greatly expanded with respect to the exportable information (11 new options)
- RTF exports include footers and headers
Logbook
- Search within your logbook
MAXDictio
- You can store the number of words in a document as a variable document
Stats
- The contents of the output viewer remain stored even after you close Stats
- Document sets created in Stats can also be viewed and deleted without closing Stats
Miscellaneous
- Quick contact to the MAXQDA team via built-in feedback field
- New start screen with up-to-date news
- Progress indicators have been improved
- Improved context menus providing better overviews

